What is Trend Exception Tool (TET)

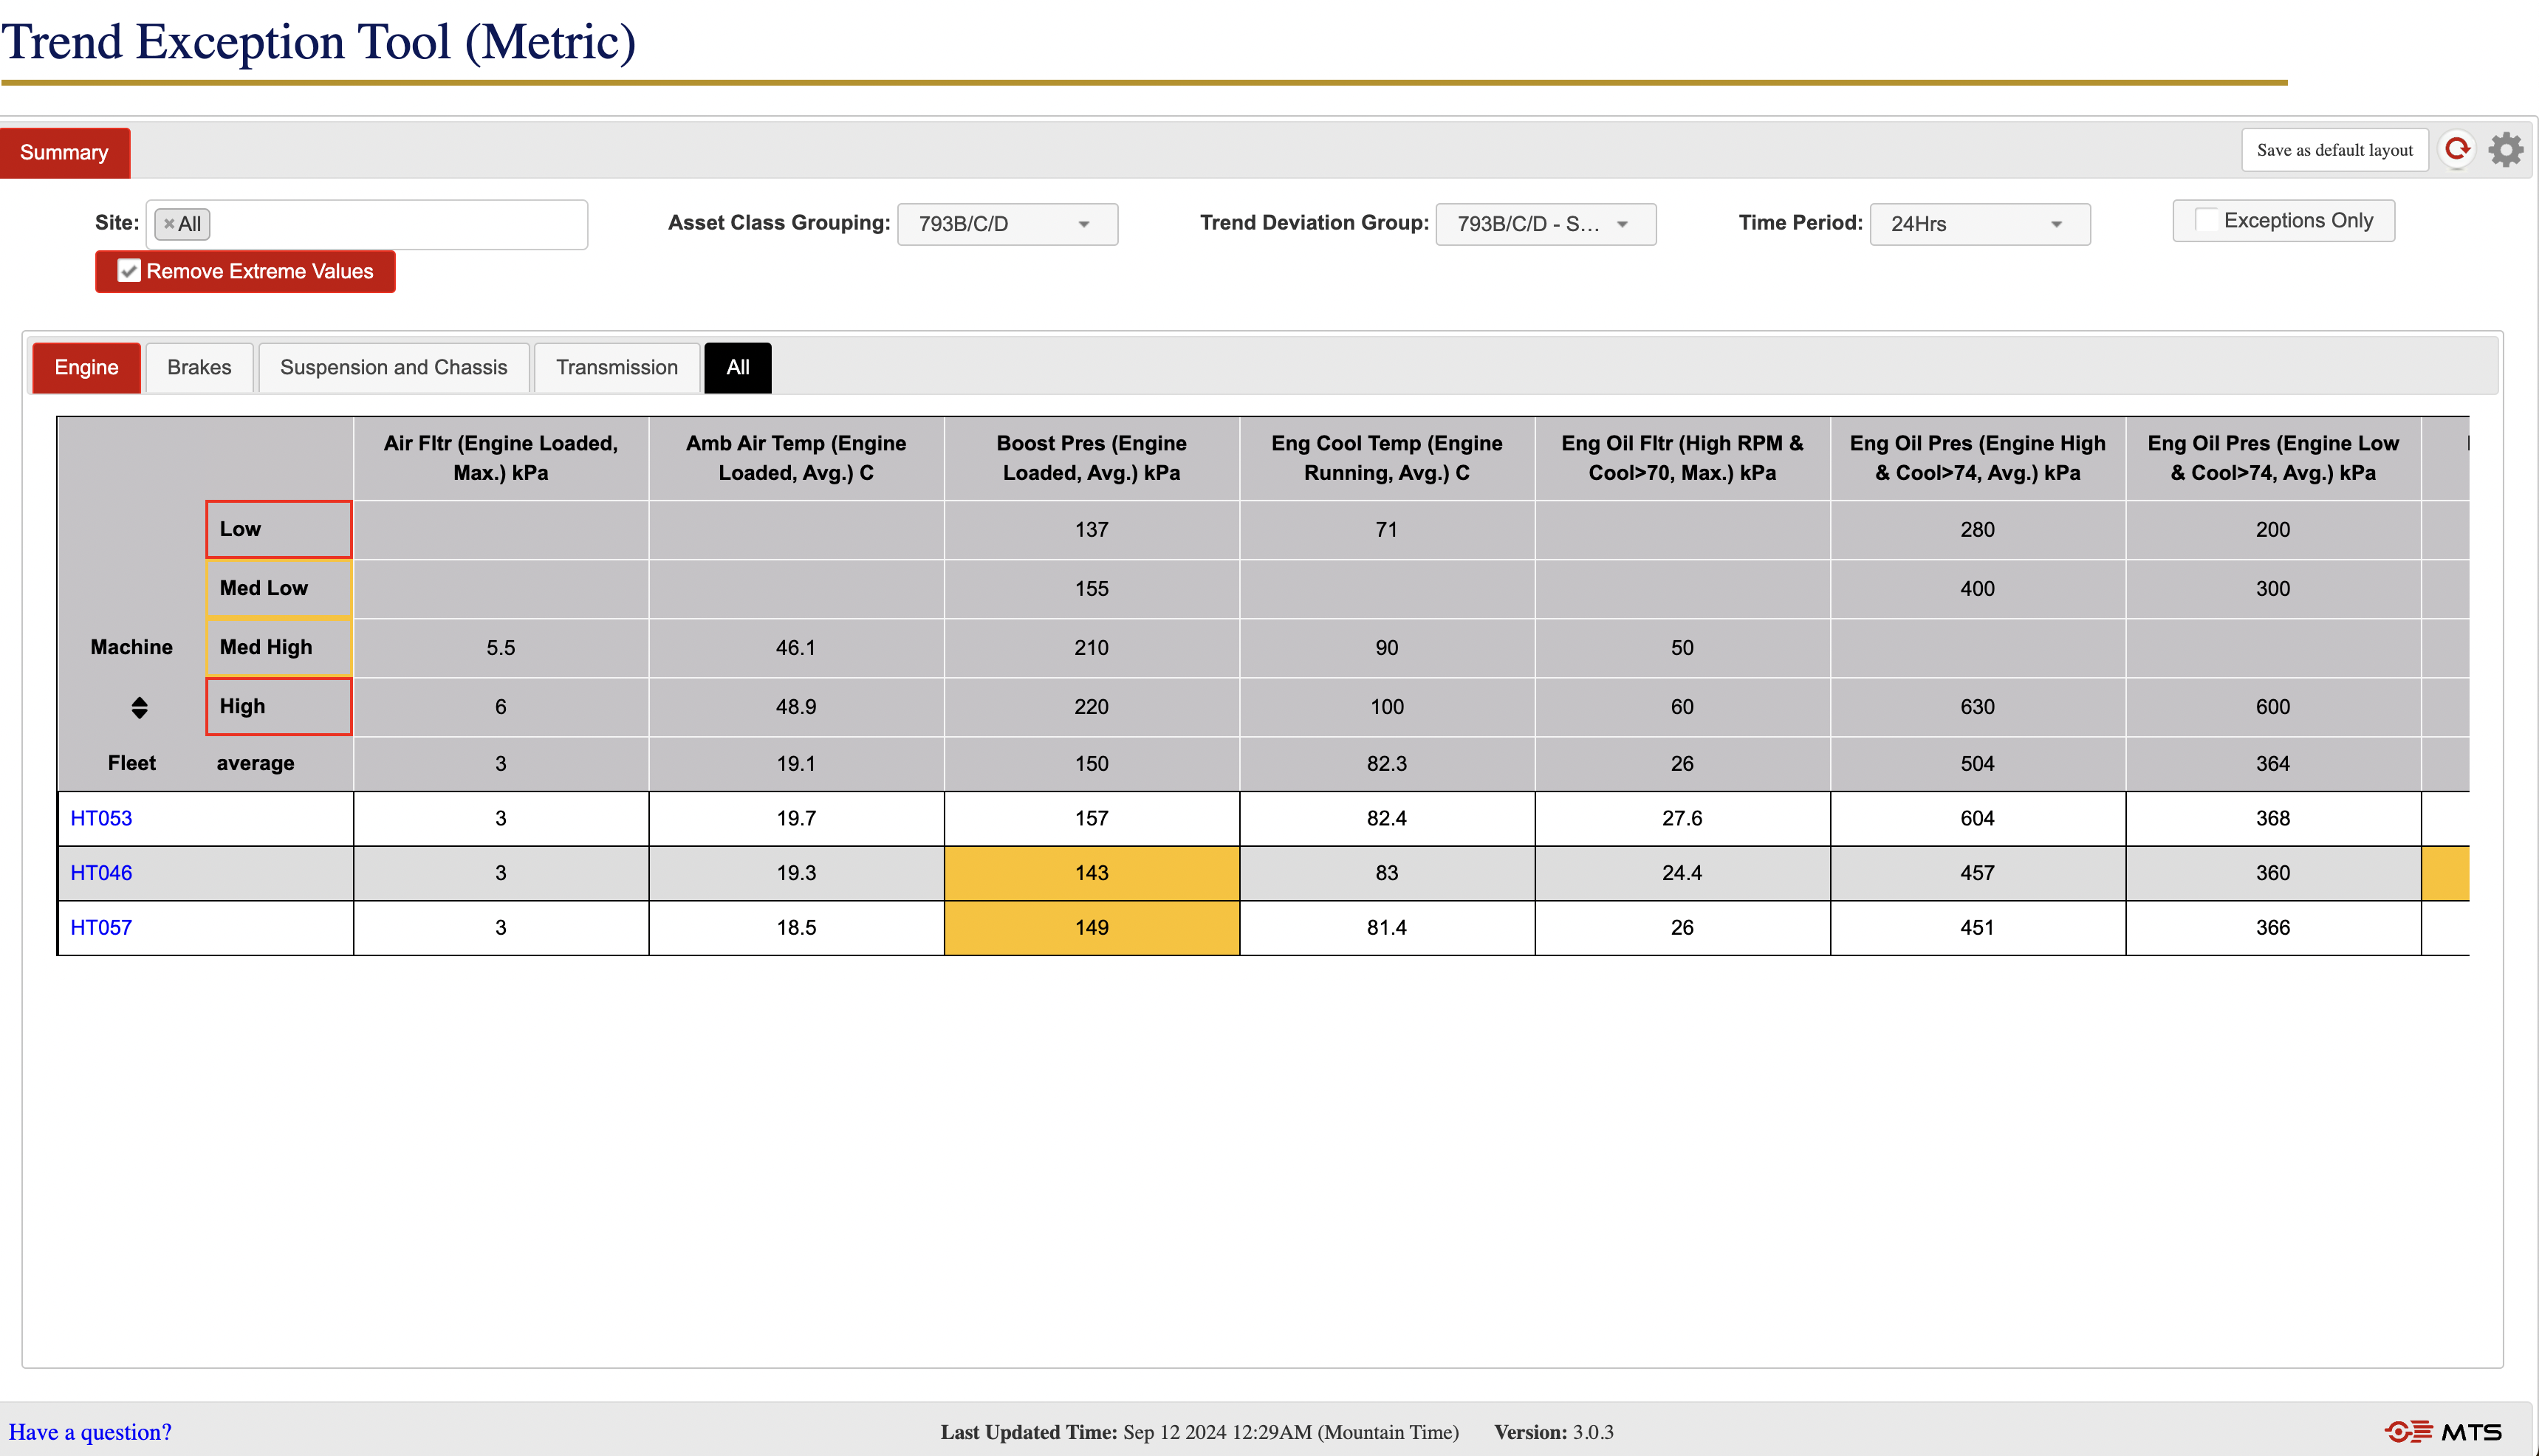
Trend Exception Tool (TET) provides a dynamic and intuitive interface to quickly identify anomalous trends in asset performance. The software connects to your asset health data sources and provides an interface to the trend data. This allows asset health analysts to much more quickly identify issues, plan an intervention, and reduce unscheduled failures.

TET has been deployed at over 30 sites world wide and has become a proven tool to identify fleet-wide health issues and avoid many costly failures. It is fully automated, meaning there is no need to manually import data and files. TET is accessed via your web browser and does not require the installation of desktop software.

Features


TREND EXCEPTION Features

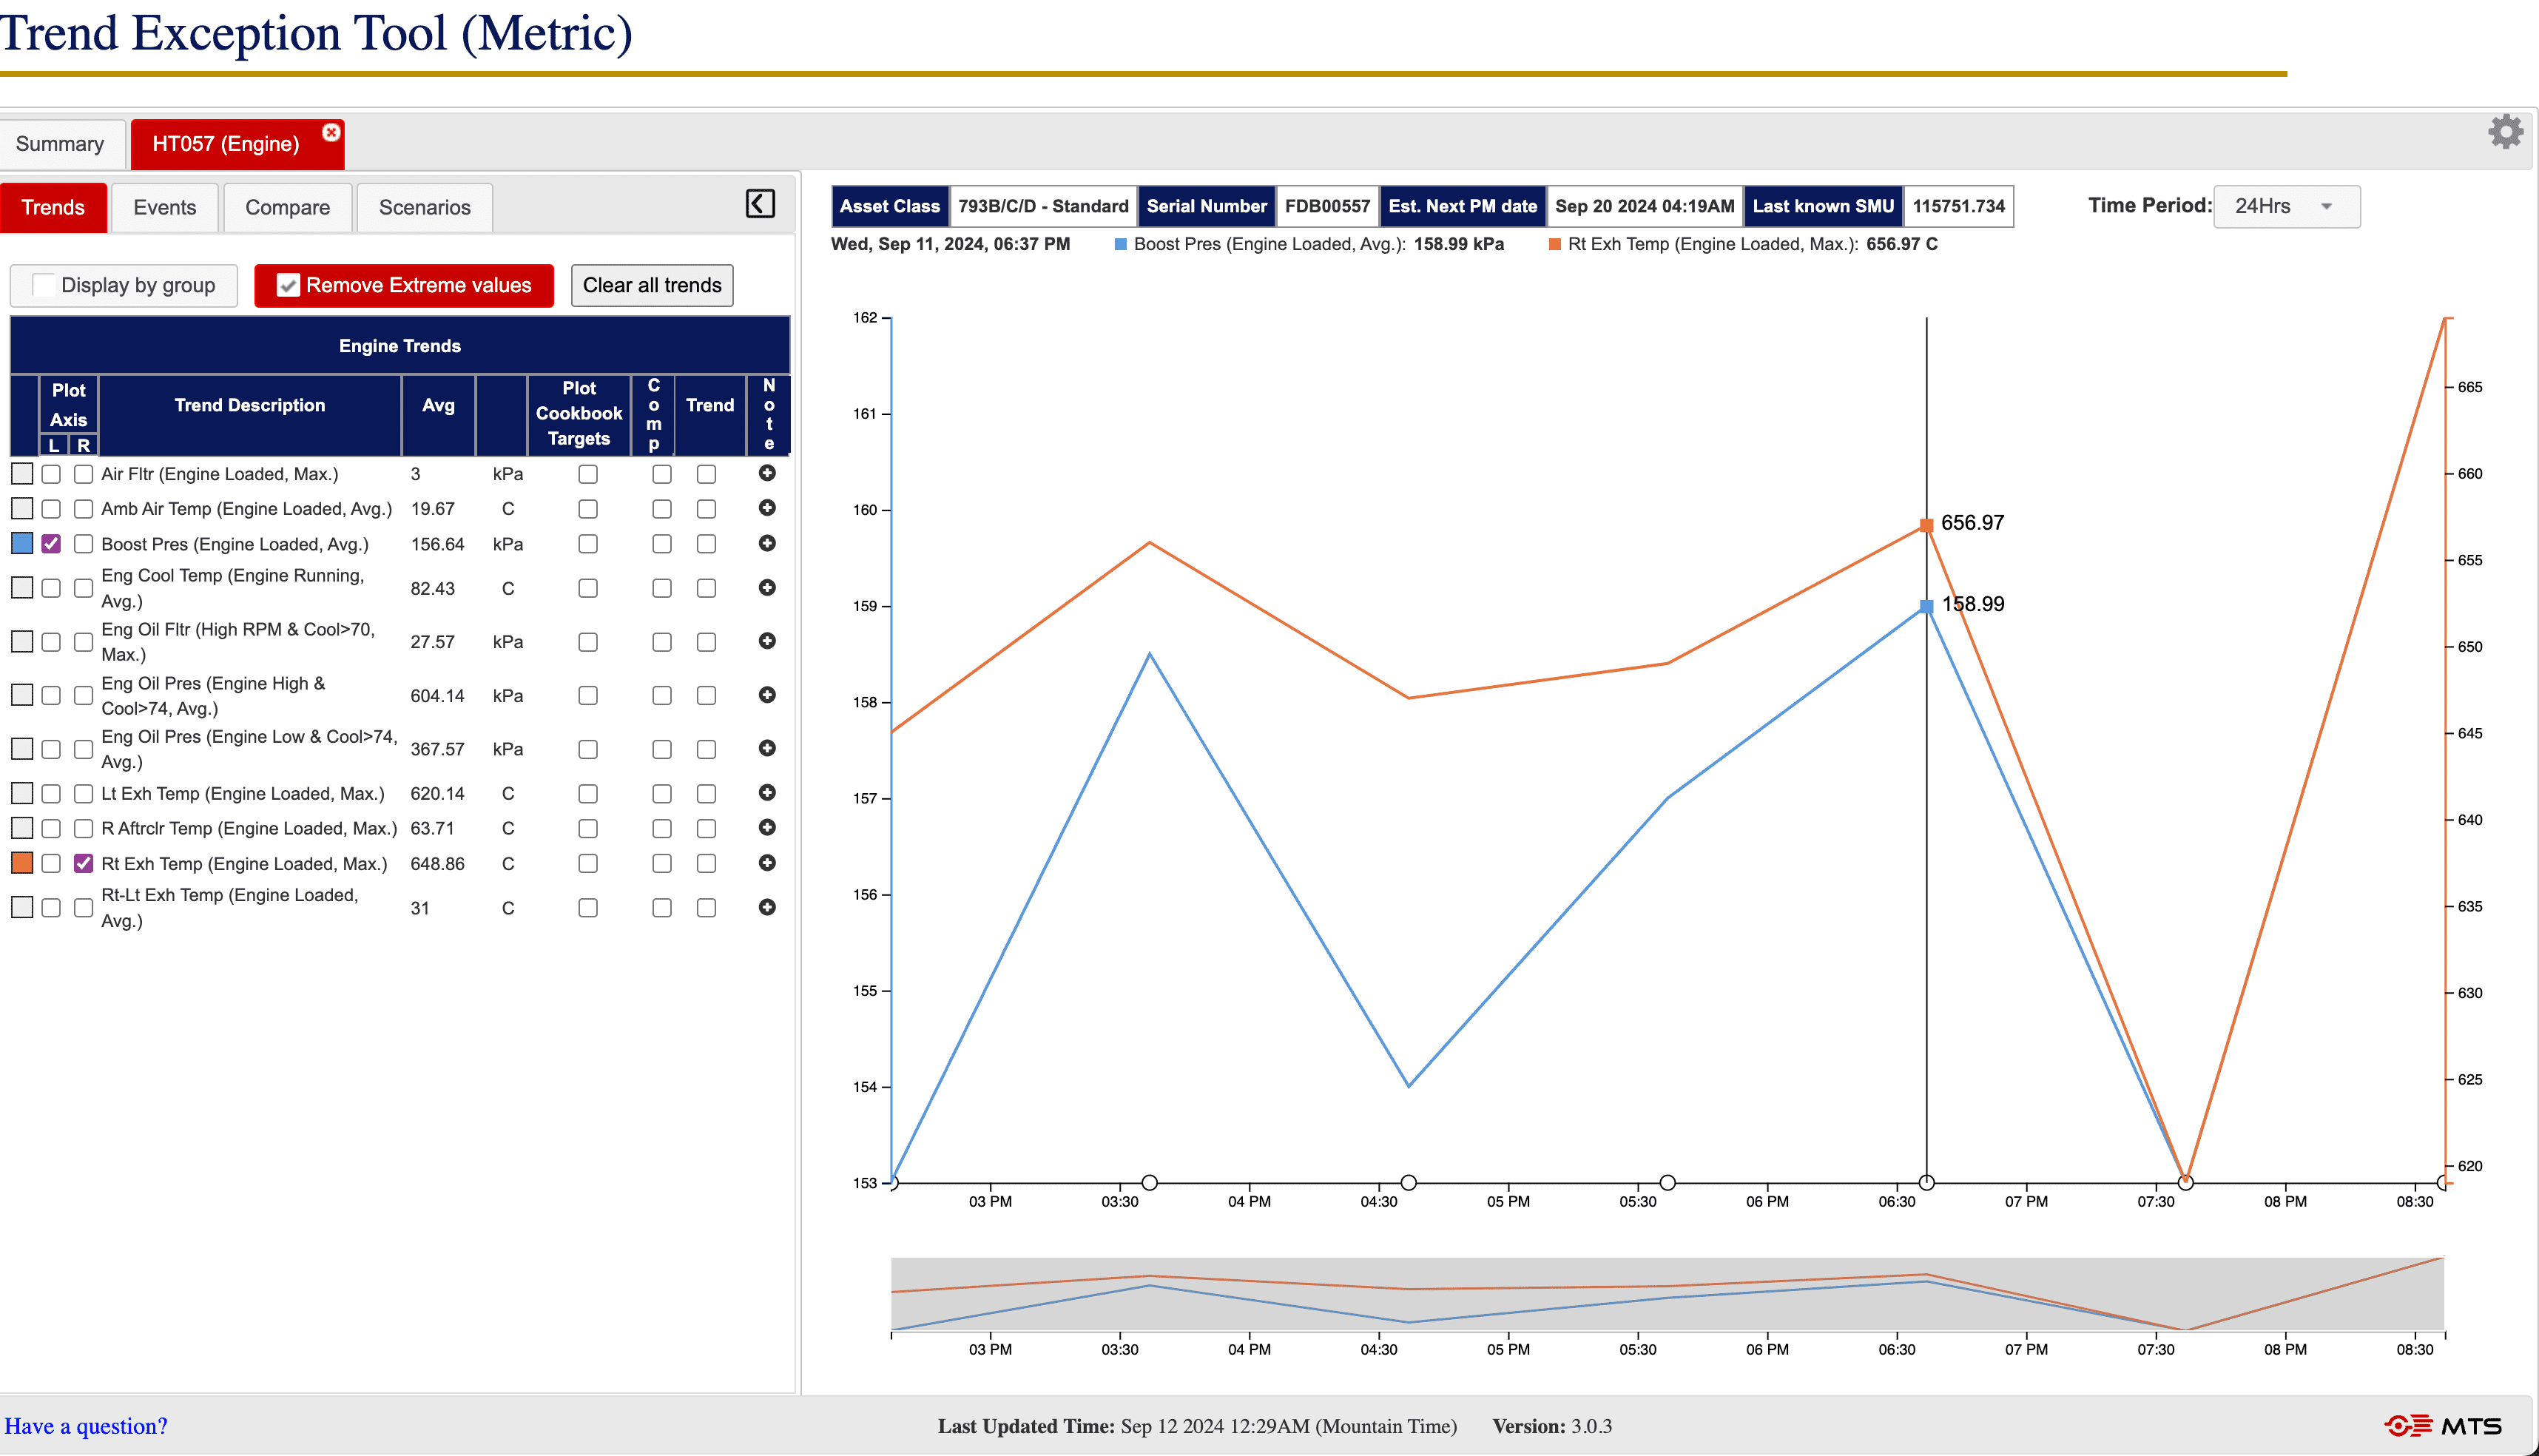
TET is an intuitive tool with multiple features, including:

  • Multi-axis chart plotting – Plot multiple related trends simultaneously.

  • Fleet vs fleet comparison – Plot similar fleet trends to identify if the anomaly is fleet-wide, or specific asset(s).​

  • Configurable thresholds – When coupled with a Report Enrichment Form set the authorised users can update limits in line with site expectations.​

  • Associated Health Events plotting – Is component health negatively trending with health alarms becoming more frequent?​

  • Ability to zoom in/out on data series.​

  • Fully automated process removes the requirement to manually import data and files.​

  • Powerful analytics tools (superior to standard ‘fixed’ PDF reporting)​

  • Web browser-based avoiding the need for desktop software.​​​​​​

TET is installed and supported by MTS dedicated service team.. To arrange a demonstration, please contact us here