Overview

The combined costs of any haulage and auxiliary support fleet represents one of the largest overheads in mining. Diligent planning and careful fleet management are critical towards ensuring your load and haul operation is running effectively and profitably.

What is Haul Road Explorer?

Haul Road Explorer is an easy-to-use, browser-based data visualisation tool. It displays the condition of both your haulage routes and haulage fleet by connecting to multiple different data sources, including your Fleet Management System (FMS) database. Information is displayed as interactive layers that can be viewed independently or combined.

Suddenly, patterns become obvious, and visibility – previously lacking – is given to event clusters, slow-spots and bottlenecks, providing powerful insight into just how well your haul roads are performing.

Features


Road Work Priority Assistant

How do you decide which roads need to be to target for clean-up?

What if you could see where clusters of site-condition asset health events were occurring, combine them with haul road speed data, and view their impact on your operation?

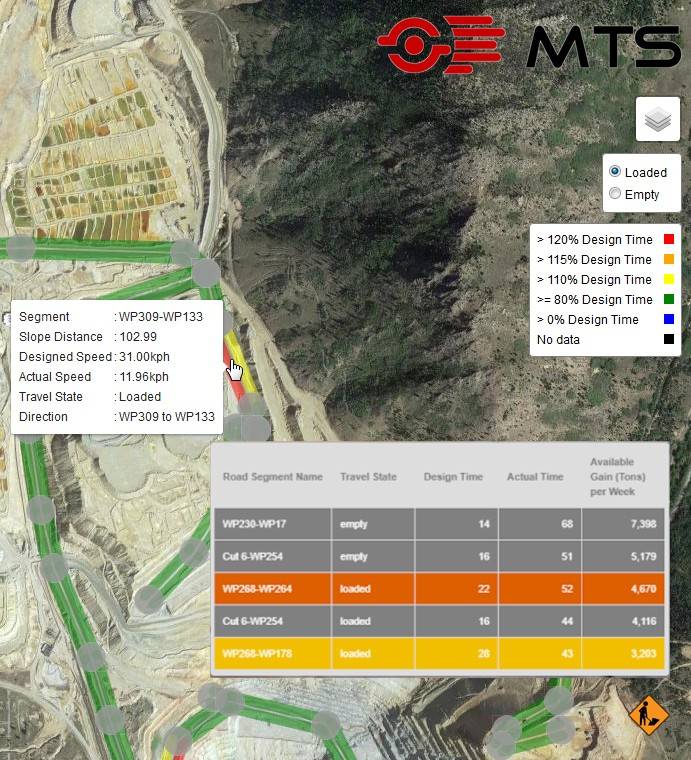
Road Work Priority Assistant (RWPA) helps you prioritise road improvement works, by identifying which road segments could yield the greatest potential gains.

Truck travel times, FMS design times and traffic levels are analysed to provide users with the top five underperforming roads based on the amount of “Available Gain”, and displayed as a simple table. Clicking any road segment ID will zoom to that location and allow users to assign a task for the repair crew.

Combined with Haul Road Explorer’s other feature layers, RWPA is an extremely powerful tool for communicating and driving haul road improvements.

RWPA enables you to make data-driven decisions and allocate road maintenance and construction resources to make the repairs and adjustments that will return maximum benefit for your operation.

HAUL ROAD EXPLORER

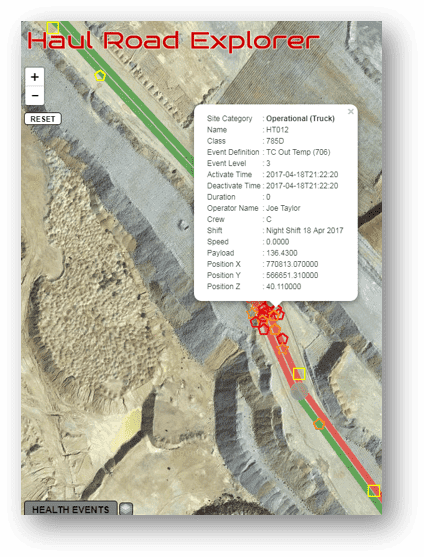
Asset Health & Haul Road Events

Are you tired of scanning hundreds of lines of PDF reports to spot asset health problems affecting your fleet?

Modern haulage fleets often come with the in-built capability to detect and communicate a wide range of event and condition indicators.

Imagine if you could visualise all those data points on a map, and filter by event type, machine, operator or severity;

  • Are these events happening at the same location?
  • Can these events be trended by the operator?
  • Is one particular machine or machine type more susceptible to any specific type of event?

By clearly and accurately displaying these events within a geospatial context, a mine controller, maintenance supervisor or general foreman can quickly spot trends and take immediate action.

This leads to a reduction in unnecessary wear on equipment, reducing operating costs, extending component life and reducing unscheduled maintenance time.

HAUL ROAD EXPLORER

Haul Road Inspections

Sometimes a picture is worth a thousand words.

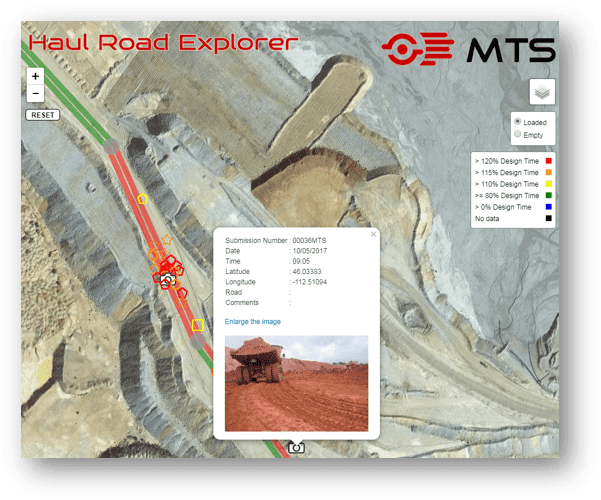
Imagine if you could perform safety, equipment or geotechnical risk inspections, geotag images and share the results on an interactive map for collaboration?

Extra context around any problem can be especially invaluable to management, remote workers and personnel that do not regularly enter the primary operational areas.

Haul Road Explorer can display images and comments as a series of geotagged mobile inspection plots.

Inspections can be carried out using any GPS-enabled device via a custom-designed mobile app. After submission, inspections automatically synchronise to Haul Road Explorer, generating a PDF report and populating a database for future customised reporting.

This can improve the communication and awareness of safety topics, encourage collaboration and swifter resolution of issues.

HAUL ROAD EXPLORER

Road Speeds

What would the ability to visualise haul road speeds do for your operation?

Understanding precisely where trucks are travelling, and at what speed, is vital to ensuring your haulage routes are operating as efficiently as possible.

Haul Road Explorer has a range of in-built haul road speed visualisations. Truck travel times are calculated using GPS, and colour-coded in relation to a road segment FMS design speed, or site-wide speed limit.

  • Road Segment Speeds: Displays the average travel time of any road segment, colour-coded by percentage of FMS design speed.​​

  • Road Speed Hotspots: Displays the speed of any point (truck GPS ping) at any point in the road, colour-coded by configurable speed bracket.​​

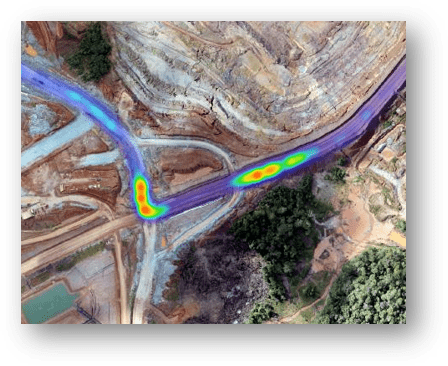
  • Road Speed Heatmap: Displays the slowest spots at any point in the road.

With Haul Road Explorer’s range of intuitive visualisations, the mine controllers, engineering team and road crews are able to see exactly where slow points on a road segment are concentrated, with the context needed to make short and long-term planning decisions.

Ultimately leading to reduced cycle time, reduced fuel burn, fewer asset health events and potentially increased production.

Task Assignment

How do you communicate and describe tasks at your mine? How do you track who is responsible and if a task has been completed?

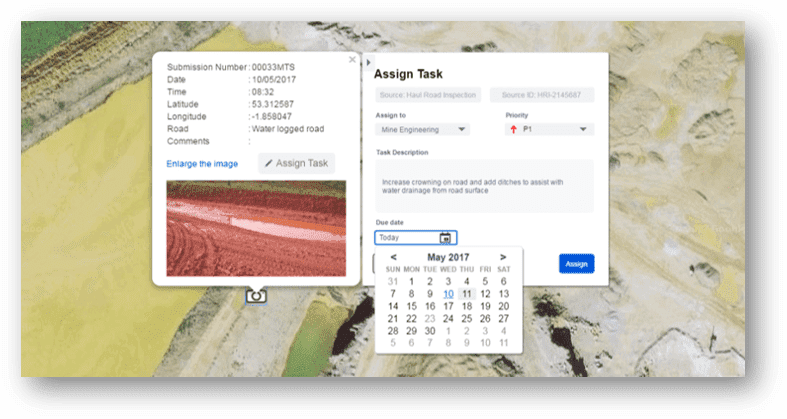
Haul Road Explorer’s Task Assignment Engine allows users to assign a task based on individual or clusters of data points from any feature layer. Tasks can be assigned to an individual or group with a due date, and can also be colour-coded by priority.

After creating or receiving a task, users are able to view and manage their tasks from a dedicated administration page. Task actions trigger simple workflows including automated email notifications, meaning everybody is aware of exactly who is responsible for doing what, where and by when.

Haul Road Explorer automatically captures and retains pre vs post-task performance data for distribution within an automatically scheduled report, providing users and supervisors with an understanding of the impact of their work on the operation.

Task assignment drives accountability within the operation and helps to ensure critical tasks are completed on schedule and according to plan.

HAUL ROAD EXPLORER