


Equipment Data Interface (EDI)
Find the root cause. Understand why. Prevent recurrence.
Understand why. Prevent repeat
Zoom in on second-by-second sensor data to understand the root causes of a failure or incident.
High-resolution data (second-by-second)
View and correlate key parameters
Identify root cause and contributing factors
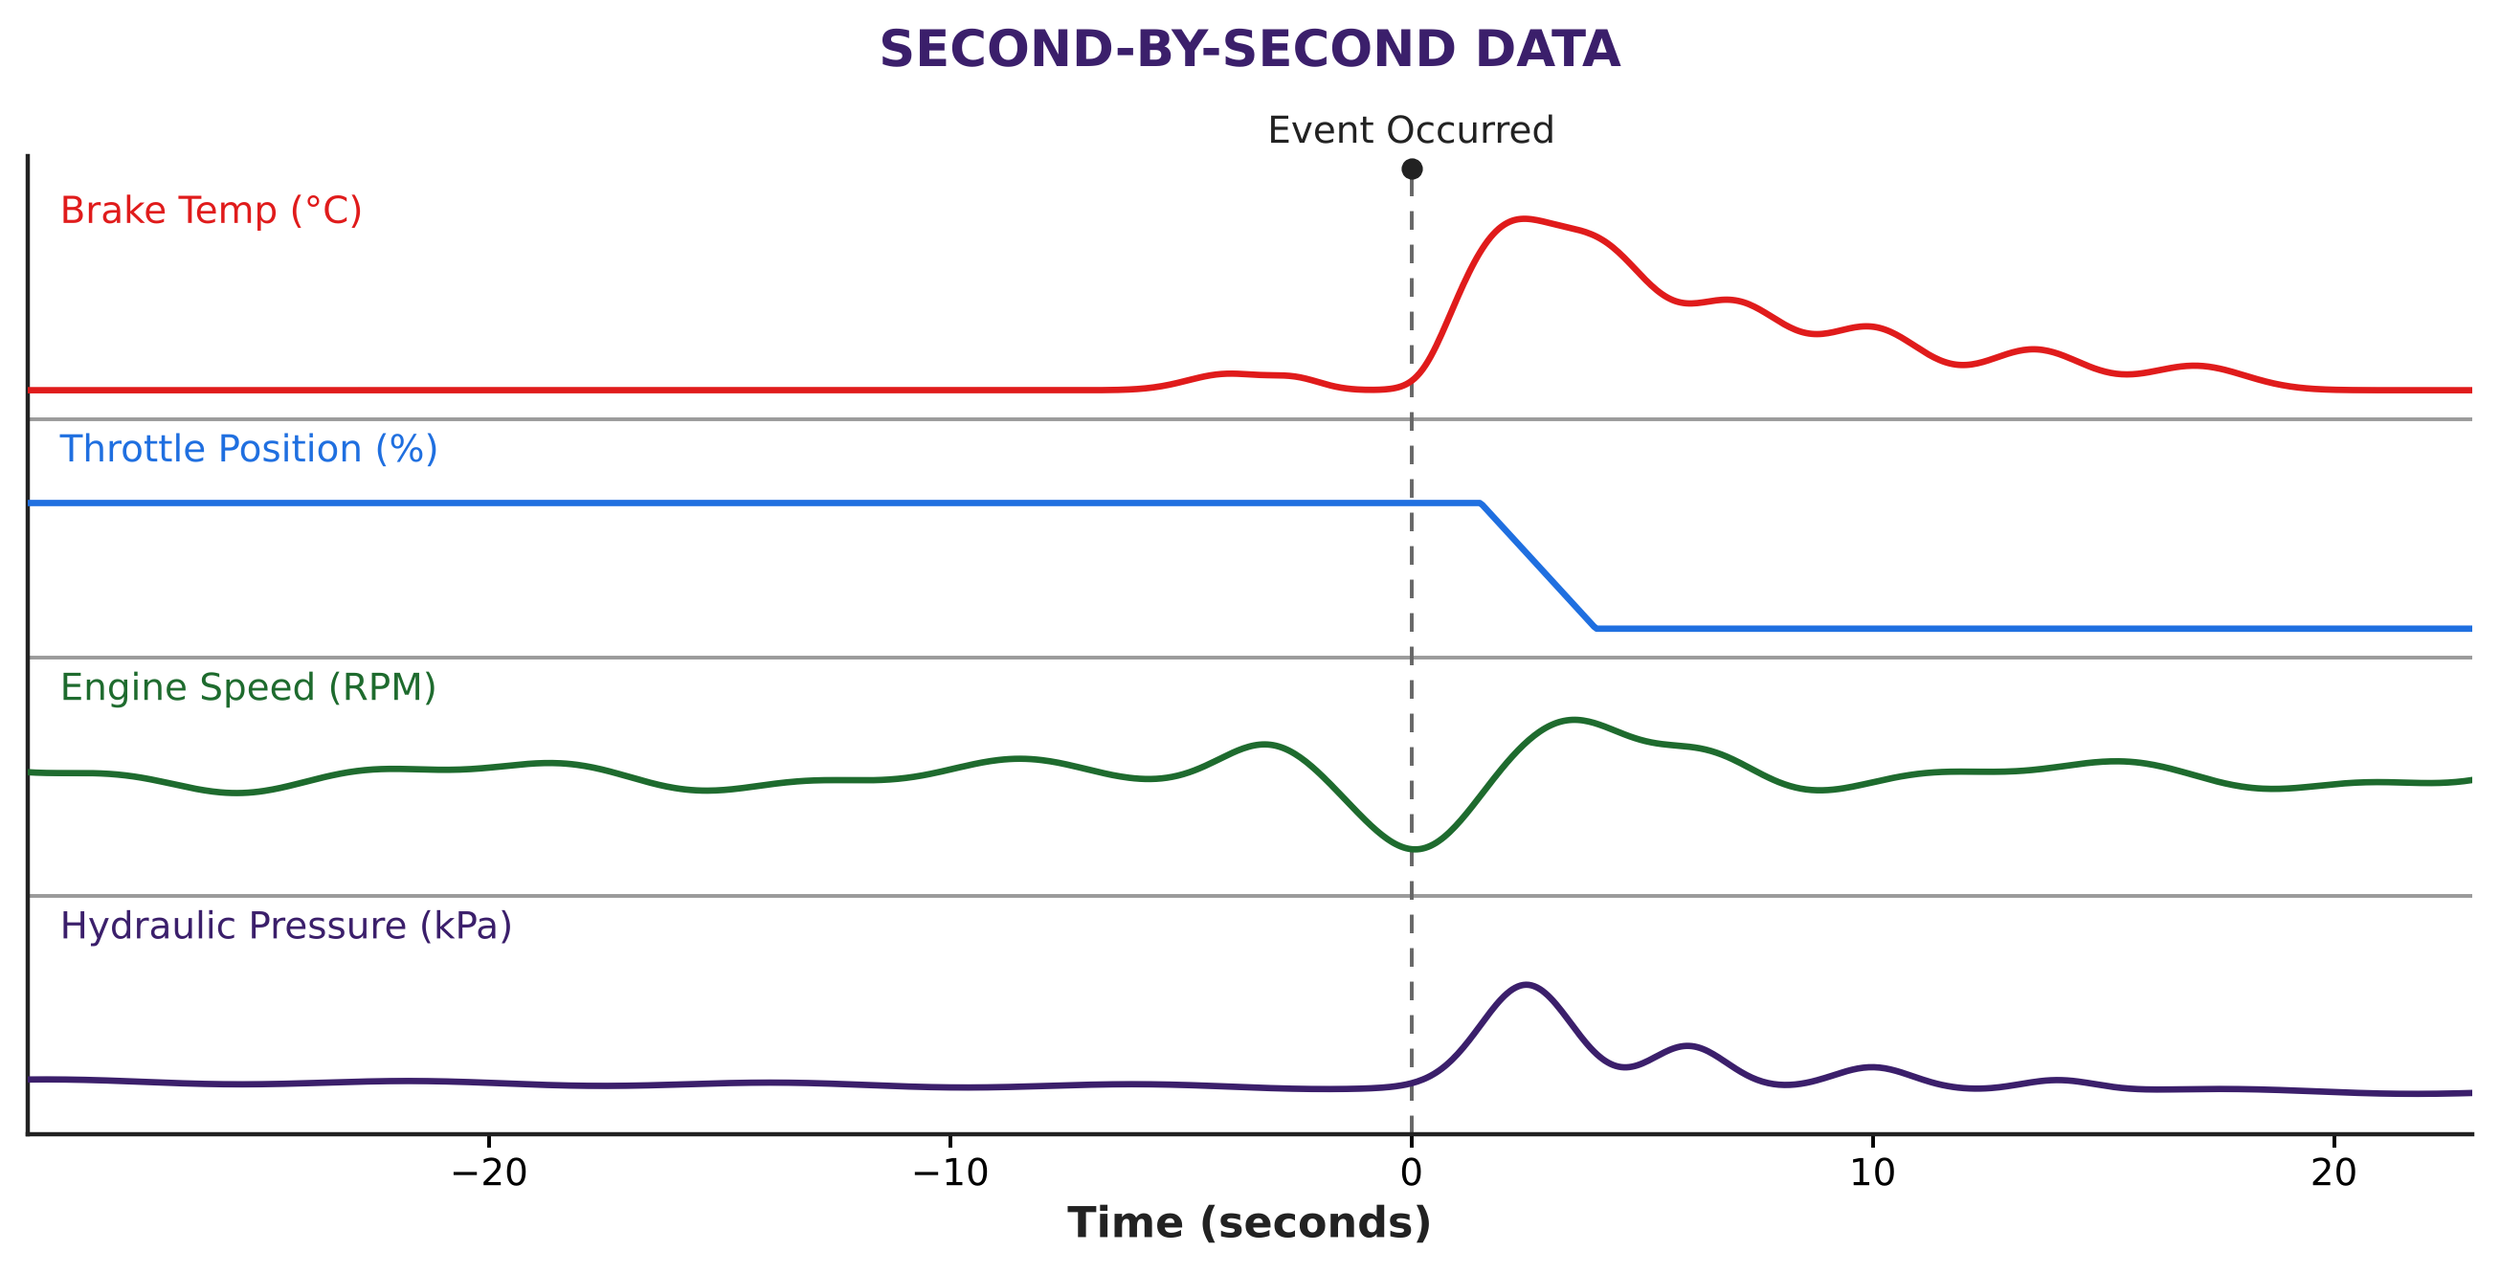
When a component fails or a machine is involved in an incident, the answer is usually already recorded onboard. Snapshots and dataloggers capture every sensor reading, second by second, but on most sites that data is never used. It’s hard to retrieve, locked in a database, or nobody has the time to dig through it.
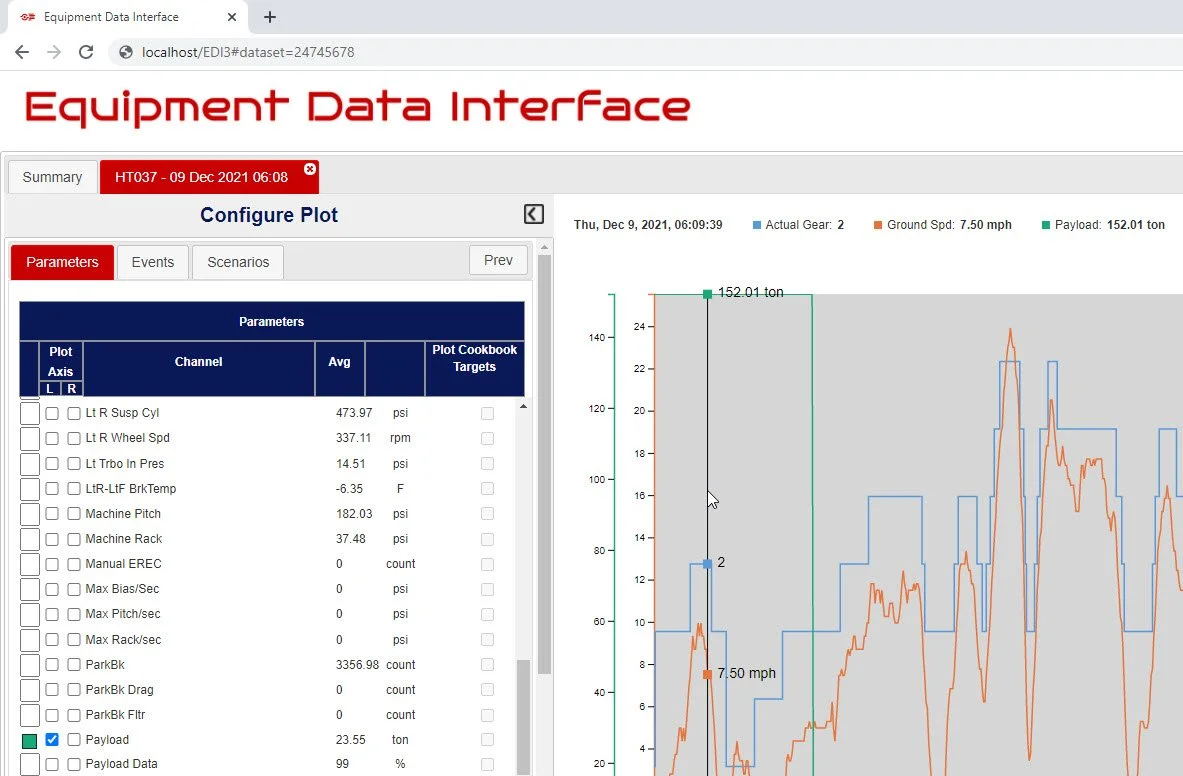
EDI turns that untapped data into answers. It connects to your asset health systems and gives maintenance analysts and reliability engineers instant, browser-based access to high-resolution machine data, ready to plot, compare and explain. This has been used to great success with sites operating a variety of manufacturers such as Caterpillar, Hitachi, Komatsu, Sandvik, iTrack, and systems such as MineStar, Wenco, Modular and MS4M. EDI is a flexible platform and can be integrated into other systems that provide machine health data as needed.
Why It Matters
Investigations in minutes, not days. Customers using EDI have cut investigation time from days to minutes. There are no downloads to request, files to chase or data to import by hand.
Find the real root cause. See which parameters moved first, how fast and in what order in the minutes before a failure or alarm. Replace assumptions with evidence.
Stop the next failure before it happens. Use what you learn to build virtual alarms or to refine trend limits in Trend Exception Tool (TET), so the next occurrence is caught early instead of when the alarm sounds.
From Dashboard To Detail In One Click
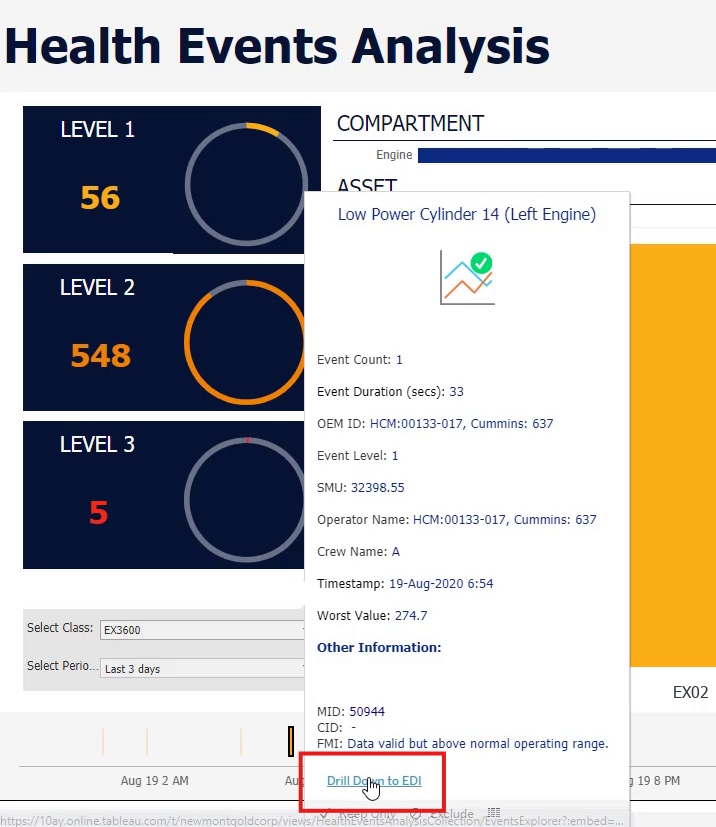
Spot a health event on a dashboard or report and wonder what triggered it? EDI drill-down links can be added to your existing health event dashboards and reports. One click and EDI finds the event, opens the period containing it and loads the available sensor channels, taking you straight from the high-level view to the second-by-second detail.
Virtual Alarms: Your Alarms, Not Just The OEM’s
OEM alarms only cover what the OEM chose to monitor. MTS virtual alarms are custom alarms built from raw data-logger data, detecting the conditions that matter to your operation.
Virtual alarms are merged with OEM alarms and appear wherever alarms are used: in EDI, TET, HRE, and your dashboards and reports.
Example: A site wanted to analyse their haulage network and identify areas where there was a poor road surface. They didn’t have the RAC system on their trucks though. Virtual alarms were created with EDI for Rack, Pitch and Bias using the raw haul truck suspension data. The OEM route would have been an upgrade costing more than $15,000 per truck. MTS built them as virtual alarms instead, giving the site the haul road insight it needed to make operational improvements without the upgrade cost.
Combined Sources: One machine, one view
A single haul truck can report to several systems. The OEM monitors the engine, drivetrain and payload, a tyre monitoring system watches pressures and temperatures, and other systems track other parameters. Each system typically only sees its own channels, so the questions that span them go unanswered.
EDI brings those sources together. Data from different OEMs and systems for the same machine is loaded in parallel and lined up on one timeline, so you can plot channels side by side that have never been seen together.
Example: Bridgestone iTrack shows repetitive tyre temperature issues, but not why. Caterpillar VIMS records the payload, speed, individual suspension cylinder pressures etc. but knows nothing about tyre temperatures, pressures etc.. Plotting them together and you can see whether hot tyres are being influenced by overloading, incorrect load placement, sustained high speed or other potential sources. Neither system can show that on its own.
That combined view turns a symptom in one system into a cause you can act on, whether that’s a payload policy, loading tool training, a speed limit on a haul segment or an operator coaching point.
See What Happened And Where: EDI In Haul Road Explorer
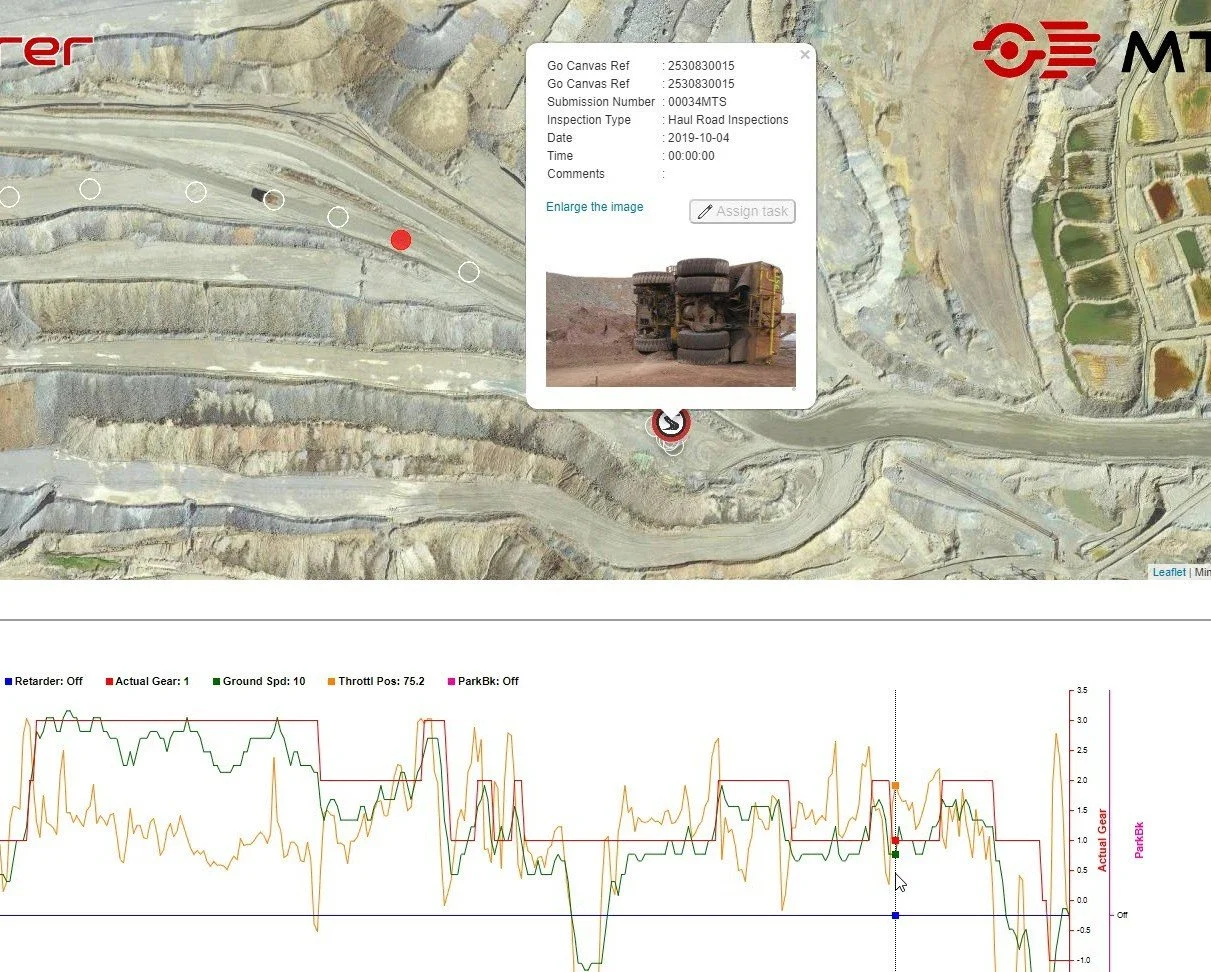
EDI is also available as a module inside Haul Road Explorer (HRE). HRE users can see both what a machine was doing and where it happened. They can replay the positions of the machine and the traffic around it, with alarms overlaid on the map.
This makes EDI in HRE especially powerful for traffic incident investigations, and for spotting geospatial patterns, such as alarms that keep recurring on the same stretch of road.
EDI And TET: Both Ends Of The P-F Curve
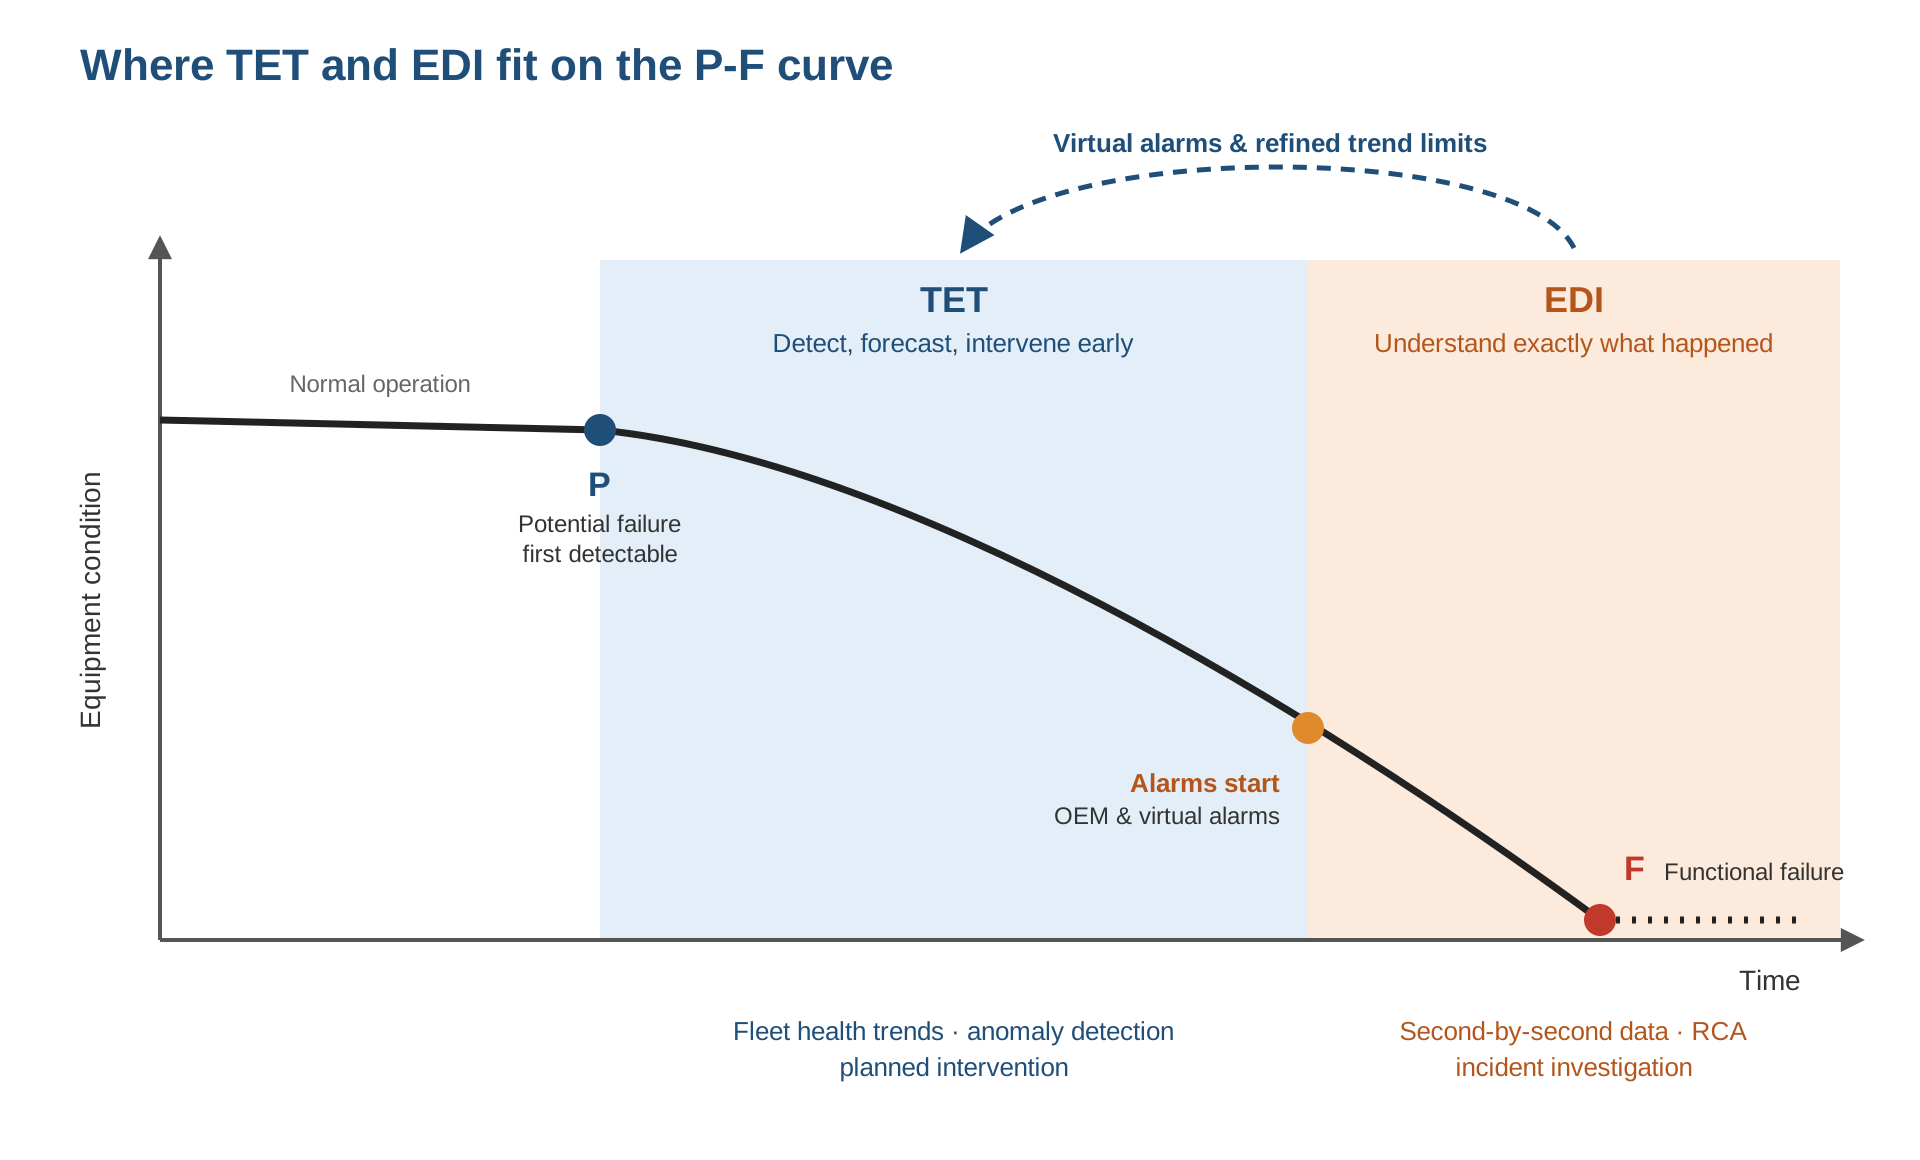
Failures develop along a P-F curve, from the point a problem first becomes detectable (P) to functional failure (F).
TET works on the left of the curve. It monitors health trends across your fleet, flags anomalies early and helps you forecast failures and intervene before damage escalates.
EDI works on the right of the curve. As alarms start to sound, and after failure, it gives you the second-by-second detail to understand exactly what happened.
Together they close the loop: EDI explains why a failure happened, and TET makes sure you see it coming next time.
Results From The Field
Days to minutes. Several sites reduced their incident investigation time significantly by removing manual data retrieval, analysis and guesswork.
About $125,000 in components protected. One customer traced the root cause of high-pressure fuel pump failures in EDI, then built virtual alarms to catch it early. This averted an estimated 7 pump failures and up to 21 days of downtime.
Built For Analysis, Not Just Reporting
Automatic data capture. Snapshots and data loggers are collected without manual imports.
Instant notifications. You can get an email when something specific occurs such as a virtual alarm or a new snapshot - easily find that needle in a haystack!
Multi-axis plotting. Overlay related parameters to see cause and effect.
Drill-down links. Jump from any dashboard or report straight to the event in EDI.
Alarm overlay. Plot OEM and virtual alarms against sensor data.
Zoom to the second. Move from the full event window down to individual readings.
Saved scenarios. Reuse an analysis set-up for recurring failure modes.
SAP notifications. Create maintenance notifications in SAP directly from EDI.
Browser-based. There is no desktop software to install.
An Unexpected Strength: Safety Investigations
EDI was built for maintenance, but sites quickly found it equally valuable after safety incidents. Objective machine data shows what really happened, whatever the first report said.
Water truck through a safety berm. The reported cause was brake failure. EDI data showed the brakes were working normally, and the investigation identified operator fatigue as the cause.
Truck tip-over during loading. The data showed the sequence of operator inputs as the truck tried to free itself from muddy ground. Together with the poor underfoot conditions, this explained the rollover and pointed to clear corrective actions.
Streamline Your Root Cause Analysis
If your investigations still depend on manual downloads, PDF reports and educated guesses, talk to us. We’ll show you how EDI can get you from incident to evidence in minutes.
Contact MTS to streamline your RCA
EDI is installed and supported by Mine Tech Services’ dedicated service team.

Why Choose MTS for your Mining Technology Needs?
At MTS, we bridge the gap between mining technology, people, and IT. Our experienced team of mining technologists is dedicated to empowering mines to enhance productivity, minimise waste, and optimise costs through the seamless integration of technology.